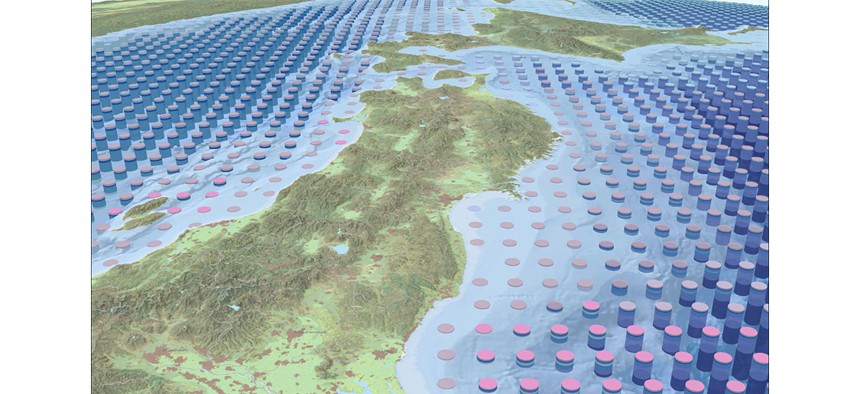
How Agency Data Turned into 3-D Maps of the Oceans

ESRI
Anyone with a web browser can click on sections of the ocean to discover key variables like salinity, temperature and oxygen levels.
Oceans cover more than 70 percent of the Earth’s surface, yet the world’s marine ecosystems are far less understood by scientists—as are the impacts of climate change upon them—than the land masses on which we live.
A new big data effort led by the U.S. Geological Survey and Esri aims to change that, by creating 3-D maps that fuse global geospatial and climatology data with information from 52 million ocean points taken over the last five decades.
Those measurements were compiled by the National Oceanic and Atmospheric Administration—the federal agency responsible for gauging the environmental pulse of the oceans—which collects raw marine data from sensors and satellite measurements in its World Ocean Atlas.
Earlier this week, Esri, in partnership with USGS, NOAA, NASA, the U.S. Fish and Wildlife Service and others, released new data sets called ecological marine units, or EMUs, which allow scientists and others to study the oceans in a more nuanced, granular way than previously possible. And they can do so in three dimensions.
“This is a first of its kind effort; it’s never been done before,” Sean Breyer, Esri project manager for EMU, told Nextgov. “We have partitioned the ocean into 37 large 3-D-mapped ecosystems with different physical and chemical properties.”
Just as cities have varying neighborhoods and demographic makeups, the oceans are not uniform places.
The Esri-led effort extracted climatology data in 27-kilometer by 27-kilometer chunks at variable depths from 52 million data points consisting of six key variables—including salinity, water temperature and oxygen levels—taken over 50 years. Breyer said approximately 30 gigabytes’ worth of NOAA’s indexed data sets were spatially analyzed and statistically clustered with a unique clustering algorithm using weeks’ worth of compute horsepower through the Amazon cloud.
The results were 37 physically and chemically distinct volumetric regions of the ocean where ecosystem properties most likely to trigger ecosystem responses are available for viewing and study. The EMUs are freely accessible via the EMU Explorer Web application, so citizen scientists, academics, conservationists and other nontechnical users can peruse the data by clicking on a point in the ocean and examining the resultant vertical profile of that location that pops up onscreen.
“Right now, anybody anywhere with access to the web can query any point in the ocean and understand the physical and chemical environment at that point,” Breyer said.
Dr. Roger Sayre, USGS' senior scientist for global ecosystems, told Nextgov the collaboration among federal agencies and Esri is “truly what brought these 52 million points of data to life.” Sayre is also the USGS global ecosystem mapping task lead for the Group on Earth Observations, a collection of more than 100 nations that commissioned the EMUs.
While the partnership and resultant EMUs could lead to wiser use of ocean resources and clearer data to relay to policymakers regarding climate change, Sayre said the public-private collaboration was “purely voluntary” with no exchanges of funding. He suggested it could serve as a useful example to others in the government who may have large data holdings not necessarily used to maximum effect.
“It really is a tremendous generosity from Esri that is allowing this work to come to fruition,” Sayre told Nextgov. “The big data nature of it, the sophistication of the spatial processing we had to do wouldn’t have been possible otherwise. The public-private partnership has really been useful in taking some existing government resources and synthesizing them in a novel and innovative way.”
The release of the EMUs may be just the beginning for an improved look at the health of the Earth’s oceans.
In a recent speech, NOAA Administrator Kathy Sullivan suggested other data sets, such as the Ocean Biogeographical Information System—an authoritative ocean biography database—“will be loaded into this.”
“Imagine how fabulous it would be to continually populate [it] from any cruise or expedition as we go forward over time,” Sullivan said.
Chlorophyll levels, geomorphology at the ocean’s bottom and other variables seem like likely targets to layer onto baseline EMUs. The existing framework may allow for the incorporation of nonbiological data sets, such as the economic and social valuation of an ecosystem’s good and services.
“We have a lot of applications in mind, but we’re looking for people out there to pick them up and run with them,” Breyer said.
NEXT STORY: Why open data needs a mission


